Data Reduction and Telemetry
Observation Timeline Modeler
Future Feature
Data Reduction Pipeline
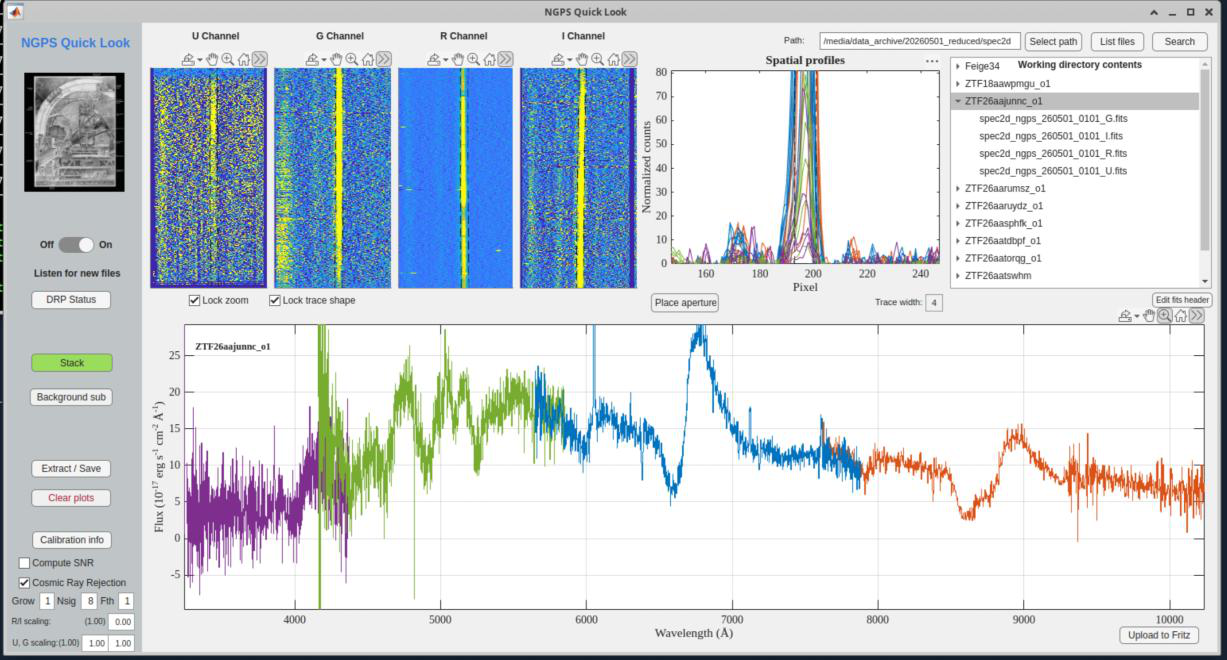
Figure 2: Quicklook DRP GUI
The Quicklook DRP is the observer-facing reduction system for NGPS. In normal operation it runs continuously on the Palomar Quicklook computer, watches the raw-data archive for new NGPS science frames, builds or selects the needed calibrations, and writes reduced products within a few tens of seconds after readout. The current production pipeline is MATLAB based and reduces all four spectrograph channels (U, G, R, I) and the three image-slicer slices independently, using calibrations matched to the observing date, slit width, and binning.
For observers, the primary interface is the Quicklook DRP GUI shown in the figure in this section. The GUI is normally open on workspace 1 of the Quicklook computer. Set the path in the upper-right field to /media/data_archive/YYYYMMDD_reduced/spec2d, click List files, and enable Listen for new files to have new reductions appear automatically. Selecting an object or a specific FITS file in the file list displays the reduced 2D frame and extracts a 1D spectrum. The Stack button sums repeated exposures of the same object until Clear plots is used.
The 1D extraction settings are intended for rapid inspection, classification, and exposure-time decisions during the night. The Trace width field changes the extraction aperture; clicking on the 2D image changes the spatial extraction location for an individual channel; Place aperture moves all channels together from the spatial-profile panel. Lock zoom keeps the same 2D display region between frames, and Lock trace shape can be useful when a bright standard star defines the trace shape better than a faint science exposure. The DRP already applies a 2D sky subtraction; the Background sub control applies an additional local background subtraction in the GUI when that is useful for crowded or structured backgrounds.
The reduction sequence applies bias subtraction, flat-field correction, wavelength calibration, sky subtraction, and flux calibration. Master calibrations are generated per channel, per image-slicer slice, and per binning mode; science reductions are skipped until a matching bias, flat, mask, and wavelength solution are available. Wavelength solutions are based on FeAr/ThAr reference atlases. Flux calibration uses sensitivity functions derived from recognized HST CALSPEC spectrophotometric standards, and
the GUI automatically selects the standard observed closest in time to the science exposure. If no same- night standard is available, a previous sensitivity function may be used; observers should klick “Calibration info” and manually select a same-binning standard when multiple binnings were used. Flux standards should stay below saturation, roughly 40,000 counts, and should reach at least about 1,000 counts, preferably closer to 10,000 counts, in the spatial-profile display. These counts can be inspected on the fly quickly by looking at the spatial profiles panel as the flux standard is being observed.
Cosmic-ray rejection is enabled by default in the GUI. The default parameters are tuned for common NGPS binning modes; for bright standards or twilight data, increase Nsig and/or reduce Grow if the 2D display looks blurred from excessive clipping. It can be helpful to disable the cosmic-ray rejection, clear the display, and re-extract the object for comparison and to assess the impact of the cosmic-ray removal. The Compute SNR checkbox provides a quick per-pixel SNR estimate for the extracted spectrum. Treat sharp jumps in the SNR curve as diagnostic rather than definitive, because narrow spectral features and residual cosmic rays can bias the moving-window estimate.
Reduced products are written under /media/data_archive/YYYYMMDD_reduced/. The spec2d/ directory contains multi-extension reduced 2D FITS files; the spec1d/ directory contains 1D spectra saved from the GUI with Extract/Save; sensitivity-function FITS files are stored at the top level of the reduced-date directory. The reduced 2D files include the bias/flat corrected data, the 2D sky model, the 2D wavelength solution, a bad-pixel map, and an illumination-flat extension.
The full Quicklook manual, with step-by-step GUI instructions and troubleshooting detail, is maintained separately at https://sites.astro.caltech.edu/~cfremling/Quicklook_MANUAL.pdf.
PypeIt data reduction
PypeIt is an independent, community-developed Python reduction package for slit-based astronomical spectroscopy. It is useful as a second reduction path for NGPS data, especially for offline analysis, comparison against the Quicklook DRP, and reductions that need the standard PypeIt QA, calibration, extraction, and output products. The Quicklook DRP remains the real-time telescope reduction system; PypeIt should be treated as a complementary science-reduction option.
For NGPS, use the PypeIt spectrograph identifiers p200_ngps_u, p200_ngps_g, p200_ngps_r, and p200_ngps_i for the four channels. The R and I channels are already represented in the public PypeIt documentation and code; U and G support is being added by Frank Verdi, and this manual assumes the completed four-channel support is available. If a local installation only lists p200_ngps_r and p200_ngps_i, update to the current NGPS-capable branch before reducing U or G data.
The recommended upstream branch for normal NGPS reductions is the PypeIt repository release branch: https://github.com/pypeit/PypeIt/tree/release. A typical source installation is: git clone https://github.com/pypeit/PypeIt.git; cd PypeIt; git checkout release; then follow the PypeIt installation instructions at https://pypeit.readthedocs.io/en/latest/installing.html.
The normal workflow is described in the PypeIt Read the Docs pages, especially Setup and Execution: https://pypeit.readthedocs.io/en/latest/ and https://pypeit.readthedocs.io/en/latest/running.html. In outline form, run pypeit_setup with the appropriate NGPS spectrograph name and the raw-data directory, inspect and edit the generated .pypeit reduction file, then run run_pypeit on that file. Run each NGPS channel as a separate PypeIt reduction, using the matching raw science frames, biases, flats, arcs, and standards for that channel and binning.
PypeIt builds its own calibration products, traces the slit/slicer apertures, solves the wavelength calibration, subtracts sky, finds and extracts objects, and writes PypeIt spec2d, spec1d, calibration, and QA outputs.
Data Management
All raw data is stored in a /data/YYYYMMDD/ directory for each UTC date. For convenience, a symbolic link is created each day from /data/latest/ which points to the current UTC. The instrument control computer performs no management of data. Palomar should appoint a person to manage data storage and removal. If an automatic data management policy were to be desired, something could be implemented at that time. As delivered, the disk can fill up, and the instrument will not function.
Telemetry
Telemetry is recorded in a telemetry database for each subsystem and is automatically copied to a computer which has public WWW access so that telemetry plots can be made available to anyone. Note that TCS coordinates are stored in a table not transferred so as not to be available publicly.
[Not fully implemented: Outside telemetry access was never implemented. TCS coordinates have not been separated. Only ACAM and Thermal telemetry has been implemented and only Thermal has a database tool.]
ACAM
The ACAM writes the following telemetry to a database, one record for every frame while the ACAM is running. [Not fully implemented: Retrieval tools were never created for ACAM telemetry].
Table 3: ACAM
NAME SOURCE DESCRIPTION CASANGLE TCS Cassegrain ring angle in degrees RAtel TCS telescope right ascension decimal hours DECLtel TCS telescope declination decimal degrees AZ TCS telescope azimuth focus TCS telescope focus AIRMASS TCS current airmass OBS_ID Target Database OBS ID of the current target read by the sequencer NAME Target Database NAME of the current target read by the sequencer POINTMODE acamd SLIT or ACAM coordinates RA Target Database RA of target read by the sequencer DECL Target Database DEC of target read by the sequencer result astrometry solver result of solution one of {NMATCH NFRACT NOISY GOOD} RAsolve astrometry solver DECsolve astrometry solver ANGsolve astrometry solver matches astrometry solver rms_arcsec astrometry solver RAoffset astrometry solver DECLoffset astrometry solver
acquired astrometry solver boolean “is acquired” seeing astrometry solver seeing_std astrometry solver seeing_zen astrometry solver extinction astrometry solver extinction_std astrometry solver background astrometry solver background_std astrometry solver filter acamd current filter name datetime astrometry solver current UTC timestamp when record is inserted into database
Thermal
Thermal telemetry is recorded to a database continuously, once per minute whenever the instrument control software is running. A Grafana interface is provided for retrieving the thermal telemetry from the database. The following table lists the telemetry recorded.
To access the Grafana page, open a browser to http://10.200.129.161:6502 and click on the “NGPS Thermal” dashboard.
Table 4: Thermal
NAME SOURCE DESCRIPTION datetime thermald / Lakeshore timestamp when record is inserted into database TCCD_U thermald / Lakeshore U channel CCD temperature TDEWAR_U thermald / Lakeshore U channel dewar temperature HEAT_U thermald / Lakeshore U channel heater TCCD_R thermald / Lakeshore R channel CCD temperature TDEWAR_R thermald / Lakeshore R channel dewar temperature HEAT_R thermald / Lakeshore R channel heater TCCD_I thermald / Lakeshore I channel CCD temperature TDEWAR_I thermald / Lakeshore I channel dewar temperature HEAT_I thermald / Lakeshore I channel heater TCCD_G thermald / Lakeshore G channel CCD temperature TDEWAR_G thermald / Lakeshore G channel dewar HEAT_G thermald / Lakeshore G channel heater TRACKSURF thermal / Campbell Electronics rack surface temperature TRACK_1 thermal / Campbell Electronics rack interior temperature near the computer and PI motor controllers TRACK_2 thermal / Campbell TRACK_3 thermal / Campbell
TRHRACK_1 thermal / Campbell Temperature measured in the electronics rack interior near the U/R flexure controllers TRHRACK_2 thermal / Campbell Temperature measured in the electronics rack interior near the I/G flexure controllers RHRACK_1 thermal / Campbell Relative humidity measured in the electronics rack interior near the U/R flexure controllers RHRACK_2 thermal / Campbell Relative humidity in the electronics rack interior near the I/G flexure controllers TCOLL_U thermal / Campbell U channel collimator temperature TCOLL_G thermal / Campbell G channel collimator temperature TCOLL_R thermal / Campbell R channel collimator temperature TCOLL_I thermal / Campbell I channel collimator temperature TETA_B thermal / Campbell Temperature measured near the blue continuum calibration electronics in the electronics rack interior RHETA_B thermal / Campbell Relative humidity measured near the blue continuum calibration electronics in the electronics rack interior TETA_R thermal / Campbell Temperature measured near the red calibration electronics in the electronics rack interior RHETA_R thermal / Campbell Relative humidity measured near the red calibration electronics in the electronics rack interior TFOCUS_U thermal / Campbell U channel focus motor temperature TFOCUS_G thermal / Campbell G channel focus motor temperature TFOCUS_R thermal / Campbell R channel focus motor temperature TFOCUS_I thermal / Campbell I channel focus motor temperature TFLEXCON_IG thermal / Campbell Temperature measured above the I/G flexure controllers inside the electronics rack interior TFLEXCON_UR thermal / Campbell Temperature measured above the U/R flexure controllers inside the electronics rack interior TACAM thermal / Campbell Temperature measured inside the A&G interior near the partition next to the camera barrel assembly