Exposure Time Calculator
The ETC allows users to explore trades between exposure time, slit width, resolution, and signal-to- noise ratio (SNR). Obtaining the required SNR and resolution for a target without wasting time under- or over-exposing spectra can greatly improve efficiency during a busy observing campaign. The calculations are only as good as the inputs, and the Universe is a messy place, particularly the weather; thus, we encourage users to include some margin in their parameters and to err on the side of longer exposures.
To access the ETC, click the ETC button in the lower-right of the observing or planning GUI. The ETC window pops up with some fields pre-populated with information about the selected target from the user’s list (if one was selected). Once all fields are filled out, clicking “Run ETC” will update the values in the topmost section with the requested computations. This will not affect the values in the target list unless “Apply to Target” is clicked.
Understanding the SNR Calculation
Please take a moment to understand our definition of “SNR” for the ETC. On CCD images, our convention is to orient a spectrum with the spatial direction running vertically (row-wise) and the dispersion or spectral direction running horizontally (column-wise). A single pixel column may be called a “wavelength bin.” For a single wavelength bin, the signal is the total number of photons collected from the source, integrated over the spatial direction (rows). Noise is the (1-sigma) uncertainty in the signal due to photon shot noise, detector noise, and sky background in the pixel column.
The ETC calculates “SNR” as the average single-wavelength-bin signal-to-noise ratio, taken over a wavelength range specified by the user. There is some freedom to change parameters related to this computation.
Measurement goals and what to calculate
On the first row of the ETC GUI, we choose what to calculate: either compute SNR given a fixed exposure time or solve for the time required to achieve the given SNR. Choose the calculation type from the drop-down list on the right. The field to be calculated will be locked out, and the other field will remain editable.
Next, we choose whether to fix the slit width or solve for it. Keep in mind that you will typically need calibration data from a standard star using the same slit width. There are multiple options for solving the slit width:
RES: Solve for the slit width that achieves the given Resolution (average over wavelength range).
AUTO: Find the smallest slit width that achieves 95% of the maximum possible SNR. Provides a balance between SNR and resolution. Both the Slit Width and Resolution fields will be locked out.
Note that there is an optimal slit width which maximizes the SNR of a point source, beyond which capturing additional sky background only degrades SNR. Also note that Resolution is affected by CCD binning in the spectral direction.
The ETC assumes that a point source is well-centered on the slit. Significant signal may be lost from poor centering (e.g. bad acquisition or unstable seeing conditions), particularly for narrow slits.
Signal extraction from a CCD
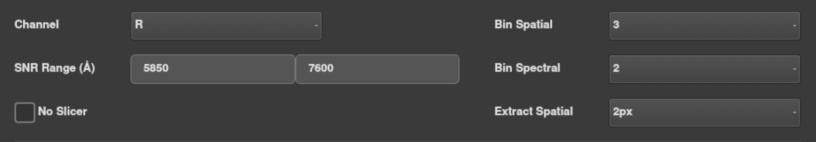
The second section contains parameters that dictate how to calculate SNR from CCD pixels.
First, we choose a spectrograph channel from the Channel drop-down. The SNR Range fields will auto- populate with a wavelength range spanning the channel center. You may change the min and max wavelengths to any values within the selected channel (keeping min<max). You do not need to know the wavelength bin boundaries precisely – the ETC will round the range to an integer number of columns, which has an insignificant effect. Choosing a narrow range will generally produce more intuitive results. The SNR per wavelength bin, defined above, is averaged over the range entered here for the single channel. Although we can imagine combining data from 2 channels with overlapping ranges to improve total SNR, that operation would depend on the user’s analysis.
Next, choose the spatial and spectral binning parameters to match the spectrograph CCD settings. Spectral binning generally increases SNR at the cost of resolution. Spatial binning can improve SNR for faint sources for which detector read noise is significant.
The Extract Spatial drop-down specifies how the user plans to extract the source signal in each wavelength bin (after calibrations are applied). The simplest method is to simply sum the N brightest pixel values in the column, restricted to the center slice. To estimate SNR for that method, select “Npx” for N = 2, 4, 6, 8… (pixels here are binned pixels). Only even values are available due to a symmetry used in the calculation. The ETC cannot anticipate how the signal peak will align with the pixels in practice, so SNR accuracy will be lowest for 2px.
The optimal way to extract a signal is to model the row-wise spatial profile (the PSF) for each column and perform a 1-parameter fit for the profile amplitude. To estimate SNR for this method, choose PSF from the drop-down. A generalized version of this method would extract the signal in all three spectrum slices using a single amplitude that scales three profiles simultaneously. If the No Slicer box is left unchecked, the SNR for the PSF method will be computed using all three slices, which should give the maximum possible SNR for the instrument. Checking the box will use only the central slice. The box has no effect on the Npx method.
At this time, we recommend that users keep the No Slicer box checked unless exploring future instrument performance. Unfortunately, SNR calculations involving all three slices will be inaccurate due to the difficulty of modeling known issues with the current slicer hardware. However, you are free to use the signals in all slices for analysis.
Sky Conditions
The next parameter section is for information about the local sky conditions:
Seeing (arcsec): The full-width-half-max (FWHM) of the seeing profile at zenith
Seeing Pivot (Å): Wavelength at which the seeing value is measured (there is a weak monotonic dependence on wavelength). The default is 6400 Å, which is around the center of the ACAM’s R filter.
Sky (mag/arcsec2): Diffuse sky background in Johnson V-band.
Airmass: Airmass of the target at the time of observation. This accounts for some extinction as well as the difference in seeing relative to zenith.
The SNR calculation can be very sensitive to these parameters, particularly Seeing (for narrow slits)
and Sky (for faint targets). It is important to update them accurately for current conditions.
Future feature: Auto-populate these fields using real-time measurements from the ACAM.
Future feature: Background measured from ACAM specified in the ACAM filter, not Johnson V.
Future Feature: Add an extinction parameter that is measured from ACAM.
Modeling the Source
Finally, we must specify the brightness of the source. The AB or Vega magnitude system is selectable from the drop-down menu. Magnitude refers to apparent magnitude observed from just outside the Earth’s atmosphere. It is defined for a particular band or filter, available from the Filter drop-down menu. The checkbox is used to specify an extended source (instead of the default point source), in which case the magnitude value is interpreted as mag/arcsec2.
The ETC accounts for extinction due to airmass but not weather conditions such as clouds. Users must manually adjust the mag here based on e.g. ACAM images.
By default, the ETC assumes a constant mag model (flat spectrum), but other spectrum models or templates can be specified using the Expert field. The computed SNR should not be very sensitive to the model if the SNR Range setting is within the Filter bandpass range.
The “match” Filter option is extremely useful here for improving accuracy. It will define the magnitude over a top-hat-shaped band that matches the user’s limits in the SNR Range setting. Thus, we are specifying the magnitude of the source in precisely the same range that we are calculating the SNR. In that case, the calculation is not very sensitive to the spectral shape, and the default constant mag model should be sufficient. Keeping the range relatively narrow (<100 Å) improves accuracy further. By contrast, consider an extreme opposite case, e.g. where we specify the magnitude in I-band and compute the SNR around 4000 Å (U-band). An accurate model of the spectral shape is needed to connect those two bands. We strongly advise you to avoid setting up the calculation this way if possible.
TODO: Add instructions for the Expert field (for power users). Put in appendix?